How to Define Value Level Indicators (VLIs) in Practice: A 5-Step Guide
Your dashboard is green. Latency is fine. Error rate is fine. Uptime hit four nines last quarter. Your CFO walks in and asks why renewals are flat. You don’t have an answer.
This is the reliability-value gap. And it’s exactly what Value Level Indicators are designed to close.
What is a VLI (Value Level Indicators)?
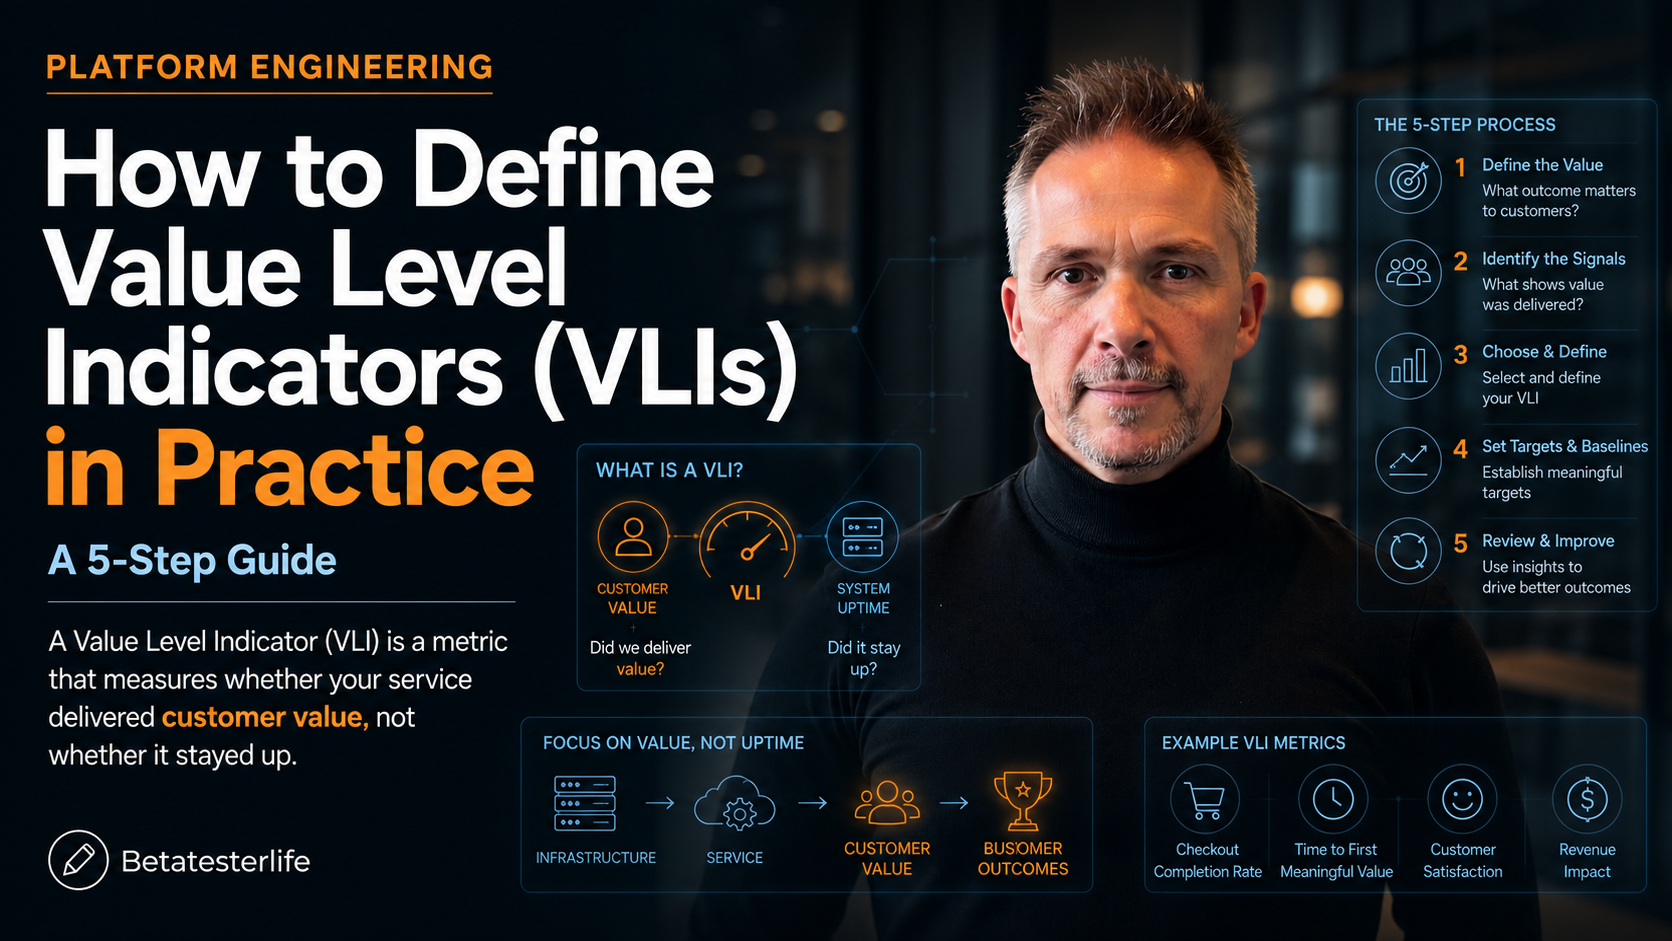
A Value Level Indicator (VLI) is a metric that measures whether your service delivered customer value, not whether it stayed up. The structure borrows directly from the Service Level Indicator pattern in Google’s SRE Workbook, which recommends defining an SLI as a ratio: the number of good events divided by the total number of events.
A VLI uses the same ratio. The shift is in what counts as a “good event.”
VLI = (value events delivered) ÷ (value events attempted), measured over a rolling window, with a threshold owned jointly by product and engineering.
The one-line definition
Why SLIs Aren’t Enough Anymore
The DORA 2025 State of AI-assisted Software Development report surveyed nearly 5,000 developers and found something uncomfortable. 95% now use AI tools. Over 80% report productivity gains. But organisational delivery metrics — the kind that show up in board decks — stayed flat. Faros AI’s telemetry across more than 10,000 developers found a 21% lift in task completion and a 98% lift in PR volume merged, with no corresponding lift in business outcomes.
They named it the AI Productivity Paradox. I think it’s something simpler. Teams are measuring activity and reliability. Neither of those is value.
The Google SRE book makes this exact point in its chapter on SLOs. The authors warn that you should start with what users care about, not what you can measure — but most teams do the opposite, because system telemetry is easy and value telemetry is hard.
The Anatomy of a VLI (Value Level Indicators)
Every VLI has four components. Skip any one and the metric collapses into vanity.
- The value event. Not a click. Not a page view. The thing the user came to do. For Spotify, it’s a track played to completion. For Stripe, it’s a payment that settles. For a search service, it’s a query that returns a result the user actually clicks.
- The denominator. Every attempt to trigger that value event. This is the part teams get wrong. If you only count successful payments, your VLI will always be 100%. You need the failures in there too.
- The threshold. The percentage of attempts that must succeed. This is set from cohort data, not from a senior leader’s gut. Look at what your top retention cohort experiences and work backwards.
- The error budget. The inverse of the threshold. If your VLI is 98%, your value error budget is 2%. When that budget burns, product priorities change. Not engineering priorities. Product priorities.

The 5-Step Recipe to Define a VLI (Value Level Indicators)
Step 1: Map the customer’s job
Before you write a query, write a sentence: “The user came here to ____.” If you can’t finish the sentence in six words, you’re not ready to define a VLI. The Insight Partners customer value mapping work is useful here — it forces you to anchor the metric to the job, not the feature.
Step 2: Find the success ratio
This is the SLI grammar applied to value. Numerator: value events delivered. Denominator: value events attempted. Worked example for a SaaS onboarding flow:
| VLI Name | First-week activation |
| Numerator | New accounts that completed the core workflow within 7 days |
| Denominator | All new accounts created in that cohort |
| Window | Rolling 28 days |
| Owner | Head of Product (with platform engineering on call) |
Step 3: Set the threshold from your retention cohort
Pull your top retention cohort from the last four quarters. What was their first-week activation rate? That’s your floor. The Reforge framework on north star metrics is sharp on this — the threshold has to be predictive of retention, otherwise you’re optimising a vanity number.
Step 4: Attach an error budget product owns
This is the part most teams skip. An SLO error budget triggers engineering work. A VLI error budget should trigger product work. If your activation VLI is burning, the answer probably isn’t to scale the cluster. It’s to fix the onboarding flow, kill the dead-end screen, or rewrite the empty state.
Step 5: Review monthly with finance in the room
This is what makes the VLI different from another product KPI. The SRE error-budget cadence — engineering, product, leadership in one room reviewing burn — gets extended to include finance. Because VLIs are what translate engineering work into the language of revenue, retention, and CAC payback. Without that translation, the metric stays a curiosity.
Three Worked Examples
| Service | VLI | Threshold | Why it works |
|---|---|---|---|
| Search API | Queries returning a clicked result ÷ all queries | 92% | Captures relevance, not just availability |
| Payments service | Settled payments ÷ payment attempts (excluding fraud blocks) | 99.5% | Excludes intended failures; counts only customer-impacting ones |
| Onboarding flow | Accounts completing core workflow in 7 days ÷ new signups | 55% | Predicts 90-day retention based on cohort backtest |
Common Failure Modes
- The 100% VLI. If your VLI never moves, your denominator is wrong. You’re only counting successes.
- The vanity VLI. “Daily active users” isn’t a VLI. It doesn’t measure whether the user got value. It measures whether they showed up.
- The orphaned VLI. If no one owns the error budget, no one acts when it burns. Goodhart’s Law kicks in within a quarter.
- The over-engineered VLI. If it takes six joins and a Spark job to compute, it won’t get computed. Start with one ratio.
The Bottom Line
SLIs answer “is the system up?” VLIs answer “is the system doing its job?” Both matter. But only one of them shows up in renewal conversations.
If your engineering org has hit SLO maturity and you’re still seeing flat business outcomes, you’re not failing at reliability. You’re missing the layer above it. Define one VLI per critical user journey this quarter. Set the threshold from cohort data. Put the error budget in front of product, not engineering. Review it with finance.
That’s how you close the reliability-value gap. That’s how the dashboard stops lying.
Found this useful? Subscribe to the BetaTesterLife newsletter for more research-grounded breakdowns of how AI, engineering, and human work are changing — every week, no fluff. Or get in touch about workshops on metric design for engineering orgs.